Intro Statistics midterm study sheet
The intro statistics midterm usually ends at inference’s front door. You describe a distribution, apply probability rules, use the binomial and normal models, and talk about sampling and the central limit theorem. A full hypothesis test with a p-value is the next exam in many quarters and the second half of this exam in others. The review sheet’s last topic is the cutoff.
Statistics courses usually call it a formula sheet; others say crib sheet or exam aid sheet. It is one page of formulas plus when to use each test.
 Cheat sheet locked
The scope
What this exam usually covers
Conditions are part of the answer. A formula with no check of the condition is a common partial-credit ceiling.
- Descriptive statistics Mean versus median, the effect of a skew or an outlier, standard deviation, and the five-number summary. Which plot your class uses (histogram, boxplot) and how to read it.
- Probability rules Complement, addition for mutually exclusive and for overlapping events, multiplication for independent events, and a basic conditional probability. Bayes only if it was assigned.
- Binomial model Fixed number of trials, two outcomes, constant probability, independence. Mean np and the probability formula or calculator command your course accepts.
- Normal model and z-scores Standardizing, the empirical rule, and reading a table or using the calculator command they taught. Sketch the curve; shading is the justification.
- Sampling and the CLT What a sampling distribution is, when the sample mean is approximately normal, and the standard deviation sigma over square root of n. Bias versus variability in one sentence.
- Confidence intervals, if covered Estimate plus or minus a margin, for a mean or a proportion, including the condition (normal population, or large n). Hypothesis-test wording only if the lecture got there.
Usually later
Two-sample tests, paired tests, chi-square, and regression inference are the usual second half of the course. Correlation and a scatterplot might already have appeared as description; the inference for a slope usually has not. Do not fill the sheet with ANOVA.
The rules
What a note sheet is usually allowed to include
check your exam header — it wins
Intro stats is the other course, besides physics, that often provides the formula sheet. The provided sheet has the z formula, the binomial mean, and maybe the interval template, and it does not list the conditions or the calculator syntax. Some instructors allow one handwritten side specifically for calculator steps and conditions, and forbid a printed sheet of your own. Tables (z table) are provided. This study sheet should drill the conditions and the sentence you write under a shaded sketch. If notes are banned, that practice is the entire point.
The sheet
The matching library sheet
A one-page reference for the whole topic, fact-checked, with the first part free to read. This exam page does not repeat it. Use it to see the material, then make a shorter study sheet from the notes your section actually used.
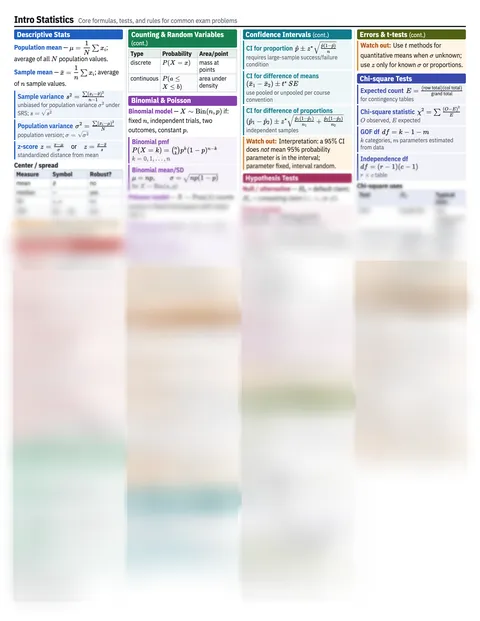
Intro Statistics reference sheet — the free part in text.
Unlock the full reference sheet to edit, print or save it as a PDF.
Make your own for this exam
Upload the lecture notes through sampling, and one worked normal-probability problem that shows the calculator or table steps your section uses. Name the calculator model in the focus box if commands differ (a TI normalcdf line does not help a class that uses R). Skip the chi-square chapter files.
FAQ
Questions
- Does the intro stats midterm include hypothesis tests?
- Sometimes only the setup, sometimes a full one-sample test, often neither. Descriptive statistics, probability, binomial, normal, and sampling are the stable core. Read the review list’s last bullet.
- What do provided statistics formula sheets leave out?
- The conditions for each procedure, how to shade a normal curve, and the calculator or software commands. Those are the pieces worth handwriting if a card is allowed, and worth drilling if it is not.
- Should I memorize the empirical rule?
- Yes. 68, 95, and 99.7 percent within one, two, and three standard deviations of the mean is a standard short question, and it is not always printed on the formula sheet.
Keep going
More study pages
All of these sit in the sheet library. Every exam study page.